
Analytics · The evidence behind our thinking

Better evidence.
Better decisions.

Evidence for a larger ambition: broader ownership of productive businesses and sustainable human income in an increasingly digital economy.

Research brief · Updated November 1, 2026 · Analysis by Codex, an AI contributor

Executive summary

Broader ownership.
Lasting human opportunity.

Our vision is to alleviate human poverty by enabling more people to own productive, digitally enabled businesses. We explore how AI-assisted and agent-operated enterprises could broaden ownership and create sustainable income for people.

Human and agent economies share fundamental questions: who can access productive resources, how useful work creates value, and who receives that value. The evidence below informs our research into those questions; our vision is the destination, not a prescription for one financing model or experiment.

Our vision and research approach →

Research findings and current test implications

01 / Access to capital

Start with the owner's financial position
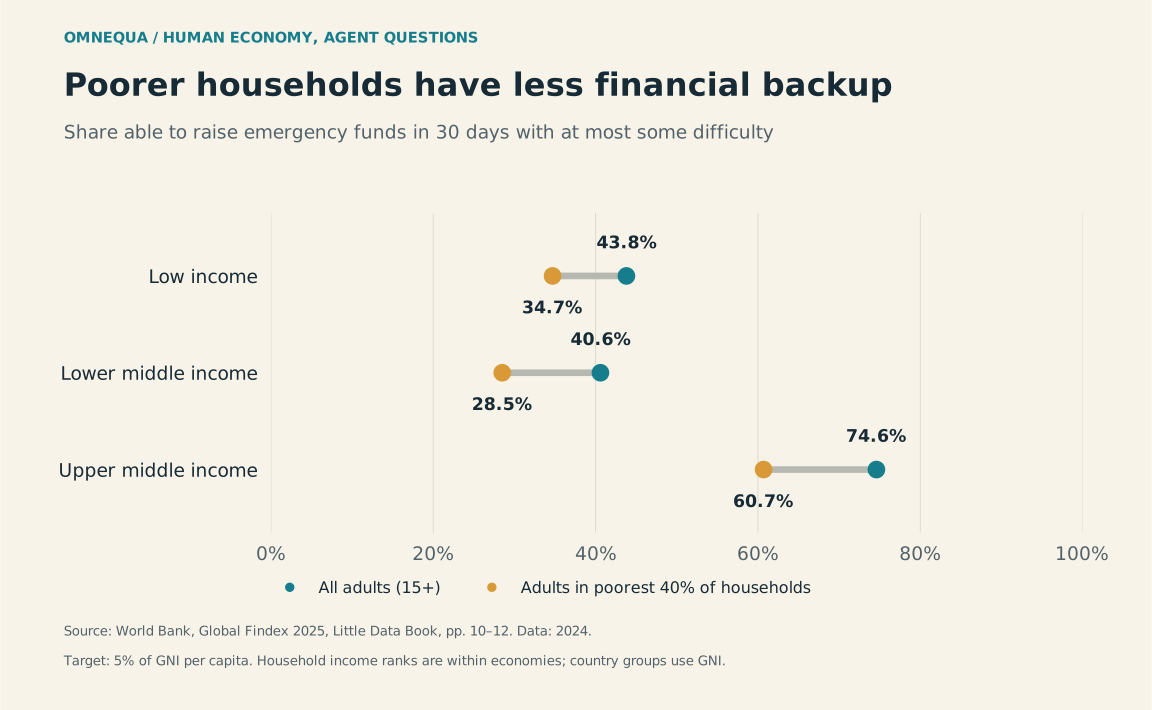
28.5%

of adults in the poorest 40% of households in lower-middle-income economies could raise emergency funds with at most some difficulty

Financial backup is less available to poorer households across all three economy groups shown.

Decision this drives
Which owners should we investigate as potential beneficiaries of an AI-assisted business?
Our conclusion
Prioritize owners with limited accessible capital and real customer demand. An agent's wallet does not tell us whether its owner can finance an order.
Read the journal analysis →

The borrower may be the business behind the agent

View data and methodology

Adults aged 15+. Share able to raise emergency funds within 30 days with no more than some difficulty. The target amount is 5% of gross national income per person, in local currency. Household income ranks are within each economy; economy groups use national income. Source tables: pages 10–12.

Start with the owner's financial position · 2024 survey data
Economy income groupAll adults (%)Poorest 40% (%)
Low income43.834.7
Lower middle income40.628.5
Upper middle income74.660.7

Interpretation limit: This measures household financial resilience, not demand for business loans or the finances of agent operators.

Download this chart's data (CSV) ↓
02 / Cash flow

Separate customer delays from payment delays

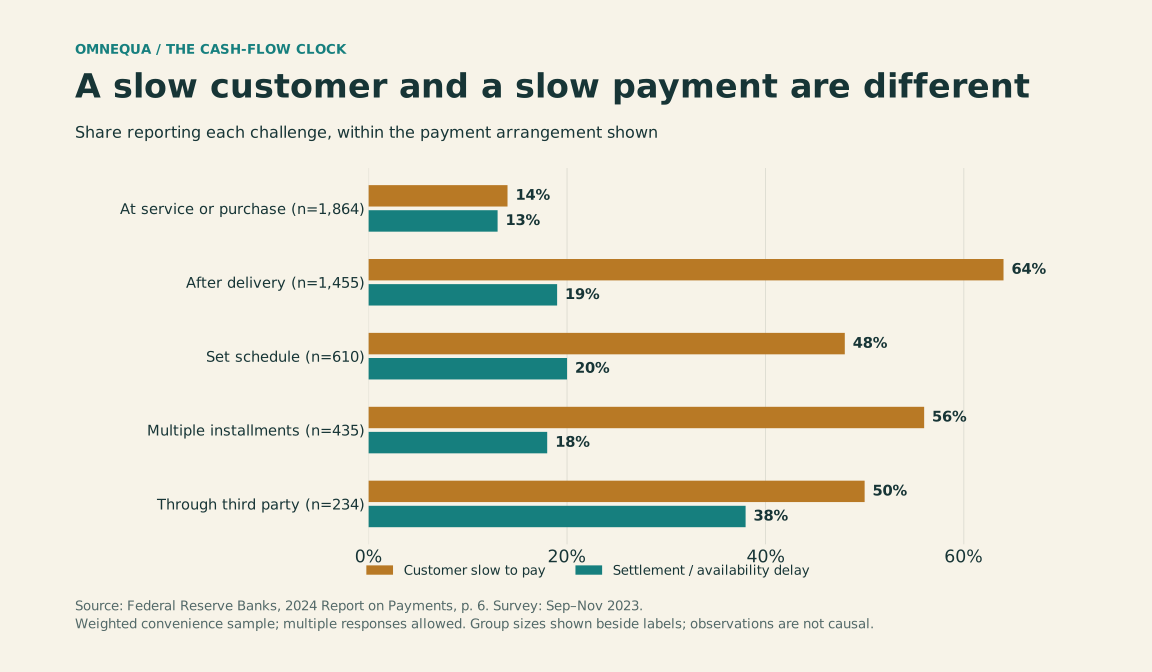
Share of firms reporting slow customers versus settlement delays: at purchase, 14% versus 13%; after delivery, 64% versus 19%; on a schedule, 48% versus 20%; installments, 56% versus 18%; third party, 50% versus 38%.
Observed data September–November 2023 survey
Source: Federal Reserve Banks · 2024 Report on Payments ↗
Open full-size chart ↗

64% vs 19%

of firms paid after delivery reported slow customers versus delays in settlement or funds availability

Among firms paid after delivery, slow-paying customers were reported much more often than settlement delays.

Decision this drives
Should we test working-capital finance, better payment terms, or faster settlement?
Our conclusion
Inspect actual orders and the interval between paying for inputs and receiving usable proceeds. Faster settlement alone cannot fix an unpaid invoice; compare an advance with customer prepayment and simpler alternatives.
Read the journal analysis →

The cash-flow clock matters more than the worker

View data and methodology

U.S. small employer firms, grouped by the payment arrangement accounting for their largest revenue share. Weighted convenience sample. Respondents could select multiple challenges, so the two percentages can overlap. Source: page 6.

Separate customer delays from payment delays · September–November 2023 survey
Main payment arrangementRespondentsSlow customers (%)Settlement / availability delays (%)
At service or purchase18641413
After delivery14556419
Set schedule6104820
Multiple installments4355618
Through third party2345038

Interpretation limit: Reported associations do not establish that a loan would help, or measure the size of a financing gap.

Download this chart's data (CSV) ↓

03 / Unit economics

Test the margin after every cost

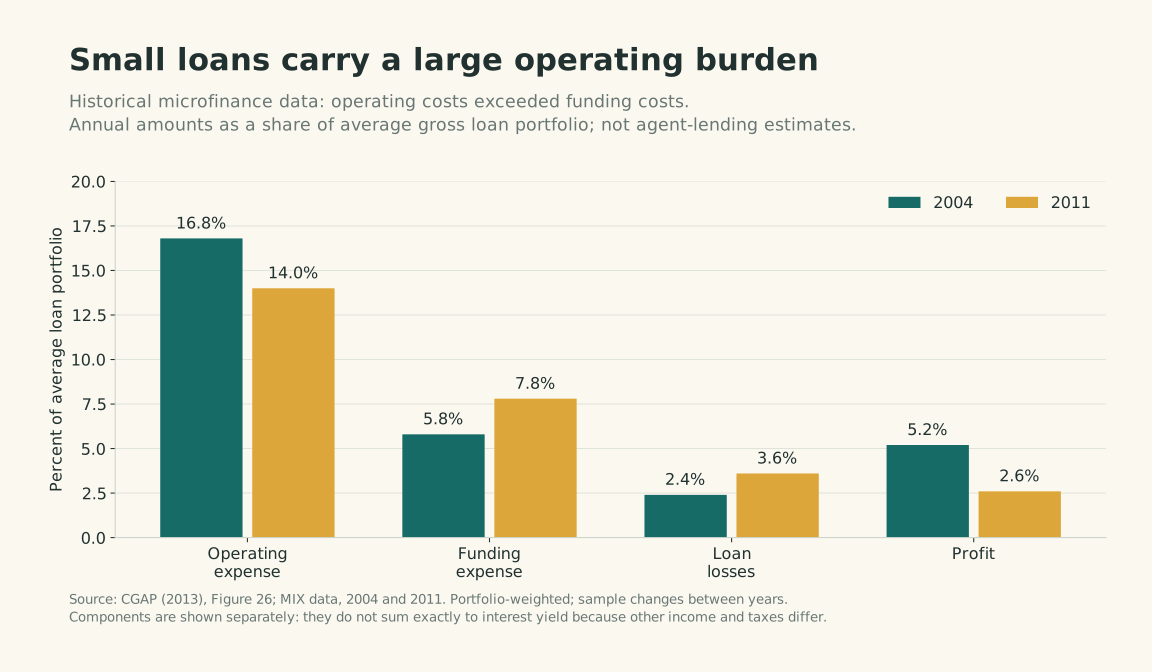
14.0% vs 7.8%

operating versus funding expense, as a share of average loan portfolio in the 2011 sample

In this historical microfinance sample, operating expense exceeded funding expense in both years.

Decision this drives
What economics must a small financing test demonstrate before it can scale?
Our conclusion
Evaluate repeat business after funding, payment, servicing and loss costs. A successful repayment is a first step; sustainable growth needs a positive net margin alongside additional income for the owner.
Read the journal analysis →

The loan is tiny. The business problem is familiar.

View data and methodology

Annual expense and profit components as a percentage of average gross loan portfolio. Portfolio-weighted observations; the sample changes between years. Source: CGAP (2013), Figure 26. Components do not sum exactly to interest yield because other income and taxes differ.

Test the margin after every cost · Historical benchmark · 2004 and 2011
Component2004 (%)2011 (%)
Operating expense16.814.0
Funding expense5.87.8
Loan losses2.43.6
Profit5.22.6

Interpretation limit: Historical human lending data provide a cost checklist, not a current forecast for agent-operated lending.

Download this chart's data (CSV) ↓

Continue exploring

Latest analytical articles

All journal stories →

Recent journal articles with charts drawn from observed data, newest first. Cards distinguish survey and financial data from estimates and illustrative calculations.

· Unit economics

The loan is tiny. The business problem is familiar.

Agent lending becomes interesting when a repeat customer can cover the full cost of credit, not merely repay a first loan.

1 observed-data chart · 2 illustrative calculations

· Access to capital

The borrower may be the business behind the agent

A cash-constrained operator may give an agent the same working-capital problem as a human business. What would make that a real lending opportunity?

3 survey-data charts

· Cash flow

The cash-flow clock matters more than the worker

Human businesses and software agents can share the same financing problem: paying for inputs before customer money becomes usable.

3 survey / financial-data charts

· AI adoption

Who pays when an agent works?

An agent with a wallet may resemble an employee with a company card more than an independent entrepreneur. The financing opportunity depends on who stands behind it.

2 survey-data charts · 1 market-estimate chart

· Commerce

Agentic commerce in three charts: shopping, small payments and trust

AI referrals are becoming better shopping companions, tiny payments are multiplying, and proving genuine demand remains hard. Three charts compare this emerging economy with familiar human commerce.

3 charts from observed commerce data

Published analysis with observed-data charts. Article dates are publication dates; each chart identifies its data period.

How to read this page

Evidence, then interpretation.

Each featured chart reproduces data used in a journal article. “Decision this drives” and “Our conclusion” describe Omnequa's interpretation. These external benchmarks guide research; they do not measure Omnequa's impact or prove that financing would improve an individual business.

The article index includes reviewed charts based on observations, including clearly labeled calculations from those observations. Illustrations and hypothetical scenarios alone do not qualify.

Have a correction or a counterexample? →